Major Exhibition will be held in 2015/5/9(Sat).
VisLab also performs a demonstration.
Update VisLab HP
Visualization and Interactive Systems Laboratory was established.
In order to effectively utilize the vast amounts of data, it is necessary to understand the data. There are various means to understand the data, but as it is said to be a picture is worth a thousand words, visualization is one of the effective means. In our laboratory, information visualization is a central research topics. We are working on design of visual representation of information, development of techniques to draw visual representation, application of visualization techniques, and investigation of the human visual characteristics.
Information visualization has no restrictions on arrangement and shape of representation. Our task is to design visual representations with functionality and aesthetics according to the purposes of visualization. We are challenging to design of effective representations for multivariate data, time-series data, geographic data, and compound data of them.
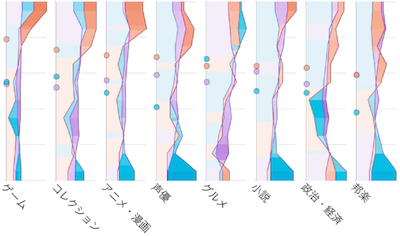
This figure shows a representation to help comparison between two or more sets with multivariate data.
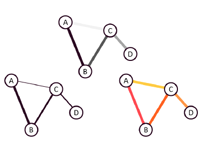
Some visual representations cannot be drawn well by naive methods. So, developing efficient algorithms to draw visual representations is also an important task. We are trying to develop algorithms to obtain aesthetically pleasing layout of a network, to draw readable charts for large amount of data, and so on.
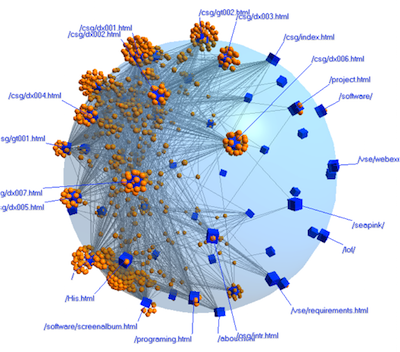
This figure shows a sphere anchored map for network drawing; some nodes are restricted on a sphere to make the network readable.
As applications of visualization techniques, we are working on a variety of system development: a visual information tool with network drawing algorithms, a visual analysis tool with statistical methods, and an intellectual work environment with the augmented reality (AR) technique.
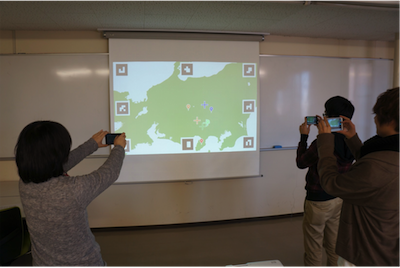
This figure shows that we are trying a visual analysis environment by lab members.
What kinds of representations are conspicuous? What kinds of representations are suitable to express values precisely? Consideration from viewpoints of readers is important to design a visual representations. It is important for such the consideration to understand human visual characteristics. However, there are many unknown part for visual characteristics, and also the way to examine is not well established. Therefore, we are accumulating knowledge about visual characteristics by performing various experiments while designing the experimental methods.