Profile

port_hyougo
Name
Yuuki HYOUGO
Affiliation
Department of Computer Science, Graduate School of Systems and Information Engineering, University of Tsukuba
Laboratory
Visualization and Interactive Systems Laboratory(VISLAB)
Career Summary
2007-2012 Department of Electronics and Information Engineering, Ishikawa National College of Technology
2012-2014 College of Information Science, School of Informatics, University of Tsukuba
Fields of Interest
Information Visualization, Geospatial data, Large scale data, life-log
Contact
hyougo [at] vislab.cs.tsukuba.ac.jp

Publication

Domestic Conference (Non reviewed)
  1. Yuuki Hyougo, Kazuo Misue, Jiro Tanaka. "Development of aggregated visualization techniques for people flow data". The 76th National Convention of the Information Processing Society of Japan, Mar 2014. (in Japanese) [PDF] [IPSJ]
  2. Yuuki Hyougo, Hiroko Suzuki, Tadanobu Furukawa, Kazuo Misue. "Development of visualization technique expressing rainfall changing conditions with a still picture". IPSJ SIG Technical Report, Vol.2014-HCI-158, No.1, pp.1-6, May 2014. (in Japanese) [PDF], [IPSJ]
International Conference (Reviewed)
  1. Yuuki Hyougo, Kazuo Misue, Jiro Tanaka. Directional Aggregate Visualization of Large Scale Movement Data. 18th International Conference on Information Visualisation (iV2014), Paris, France, pp.196-201, July 15-18, 2014. [PDF], [Slide PDF]
Others
  1. 兵吾勇貴. "大規模な移動データの集約的な可視化". 平成25年度 筑波大学情報学群情報科学類 卒業研究論文, 2014年2月. (in Japanese) [PDF]
  2. 兵吾勇貴, 川除佳和. "集合知による画像のROI抽出". 平成23年度学生による研究発表会, 電気関係学会 北陸支部学生会, 2012年3月. (in Japanese)

Research

Directional Aggregate Visualization of Large Scale Movement Data

Widespread use of GPS terminals has made it possible to collect geospatial movement data, and visualization is an effective method to understand such data. However, for large scale movement analysis, because the data set includes complex movements of individuals, it is difficult to understand using naive visualization methods. In order to solve this problem, we developed a visualization technique that can represent large scale movement data in an aggregate manner. This visualization technique has two representations: “amoeba representation” and “amoeba colony representation.” Amoeba representation represents the distance moved from a point in any direction with map scale in a geographical space, and amoeba colony representation represents movements over a wide geographical space.
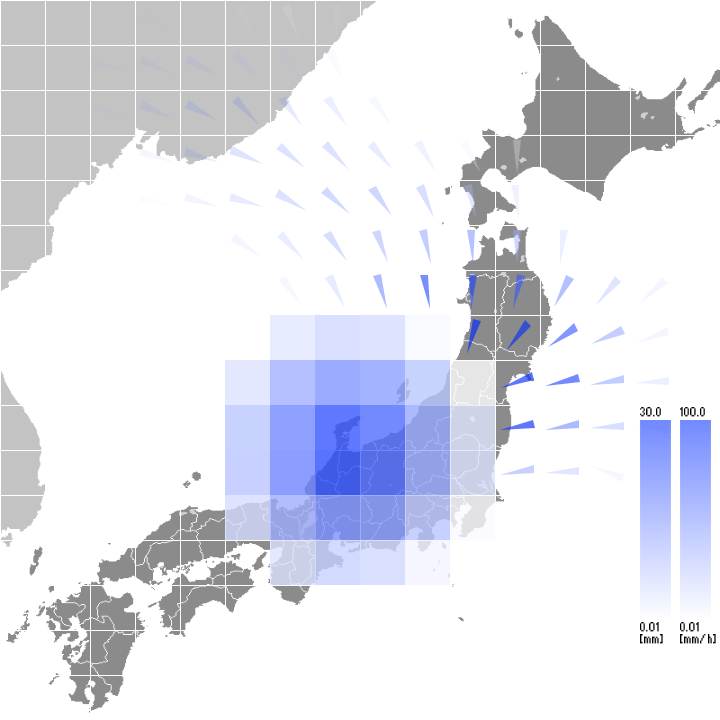
Development of visualization technique expressing rainfall changing conditions with a still picture
amatsubu representation
In order to prevent rain disasters bringing serious damage, it is important to grasp the situation and understand the expansion of the rain area. We developed a technique of expressing the area where rain falls and the direction of movement of the affected area. This technique is based on rain mesh data and uses a still image. The developed technique expresses the direction with arrows and shows the values of rainfall or rainfall accumulation with colors. Therefore, it is possible to express the rain data (which is time-series data with location information) using a still picture, without being dependent on animation. Using this technique, it becomes easy to perform decision-making and communication of information between fire brigade members.

Awards

Mar 2014
Student Award (Visualization session)
The 76th National Convention of the Information Processing Society of Japan
Mar 2014
"Shinsei-kai" award
College of Information Science, School of Informatics, University of Tsukuba